Atmospheric Rivers over Antarctica Are Being Mapped in 3D
New three-dimensional views of Antarctic atmospheric rivers show where narrow corridors of warm, moist air climb, cool and deliver snow or melt-inducing heat to the ice sheet.
Leo Sato ·
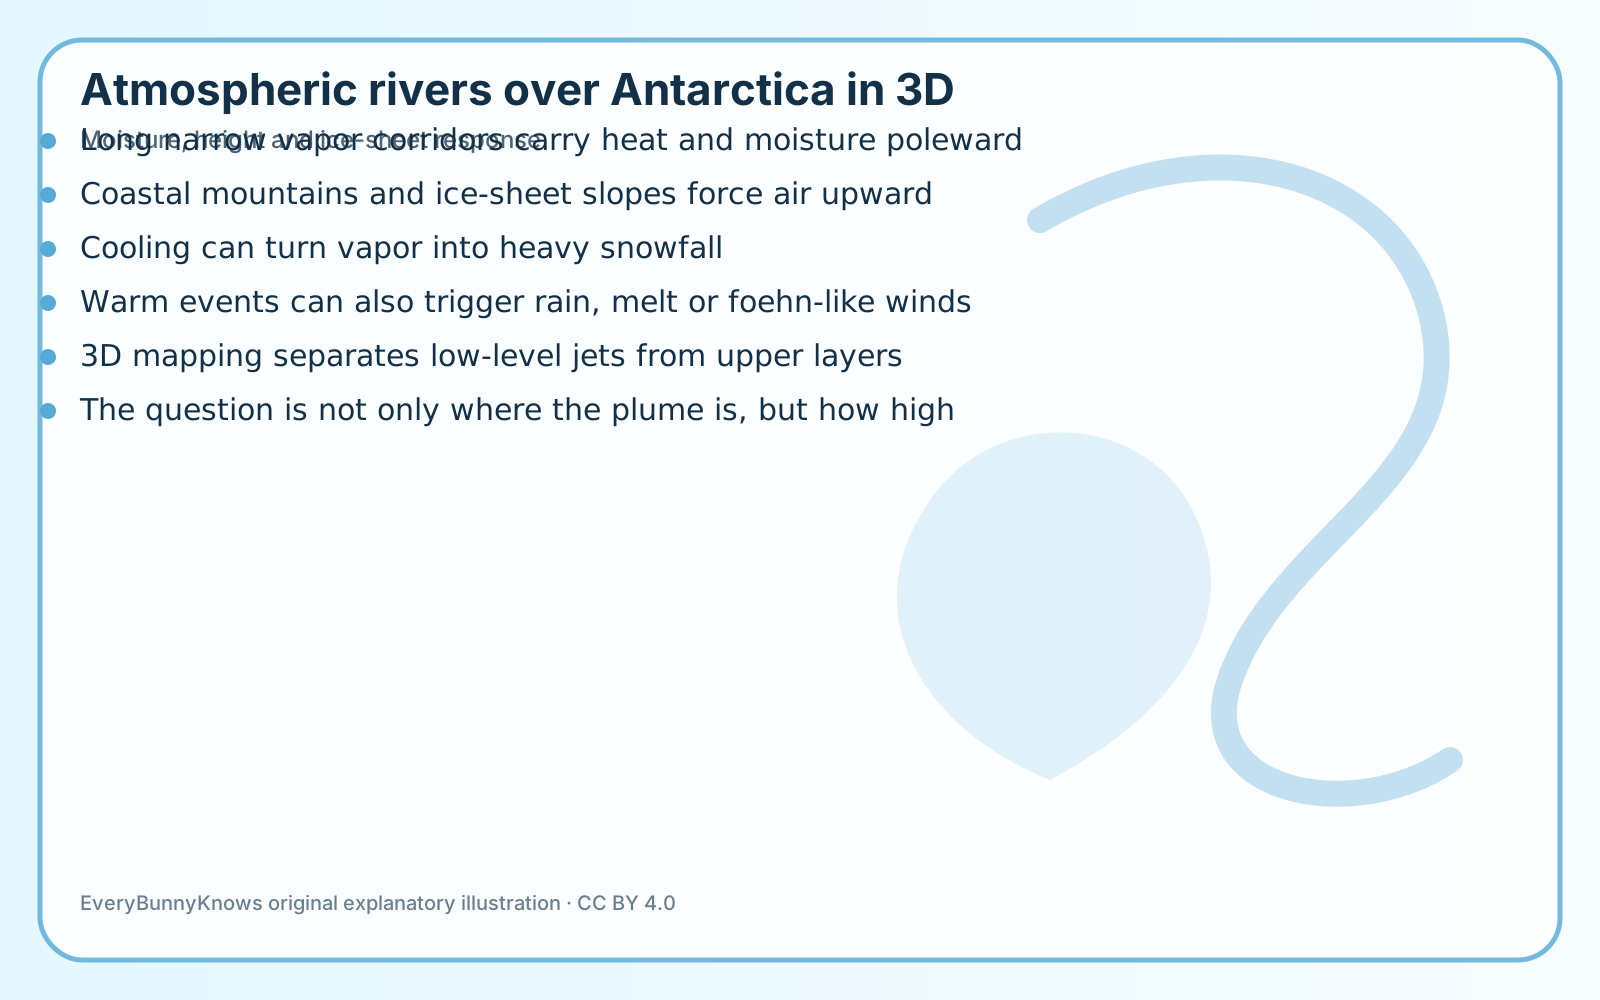
Antarctica is often imagined as a frozen desert, and that is mostly right. Much of the continent receives very little precipitation, especially in the high interior. Yet some of the most important weather events arrive as long, narrow corridors of water vapor called atmospheric rivers. When these plumes reach the ice sheet, they can deliver heavy snowfall, warm air, rain or melt-inducing winds. Mapping them in three dimensions helps explain which outcome is likely.
A flat satellite image can make an atmospheric river look like a bright streak of cloud. The real structure has depth. Moist air may be concentrated in a low-level jet, stacked through several layers, lifted by coastal mountains or sheared apart by stronger winds above. Over Antarctica, that vertical shape matters because the continent is not a simple flat target. The air meets sea ice, ice shelves, steep coastal slopes and the high plateau of the ice sheet.
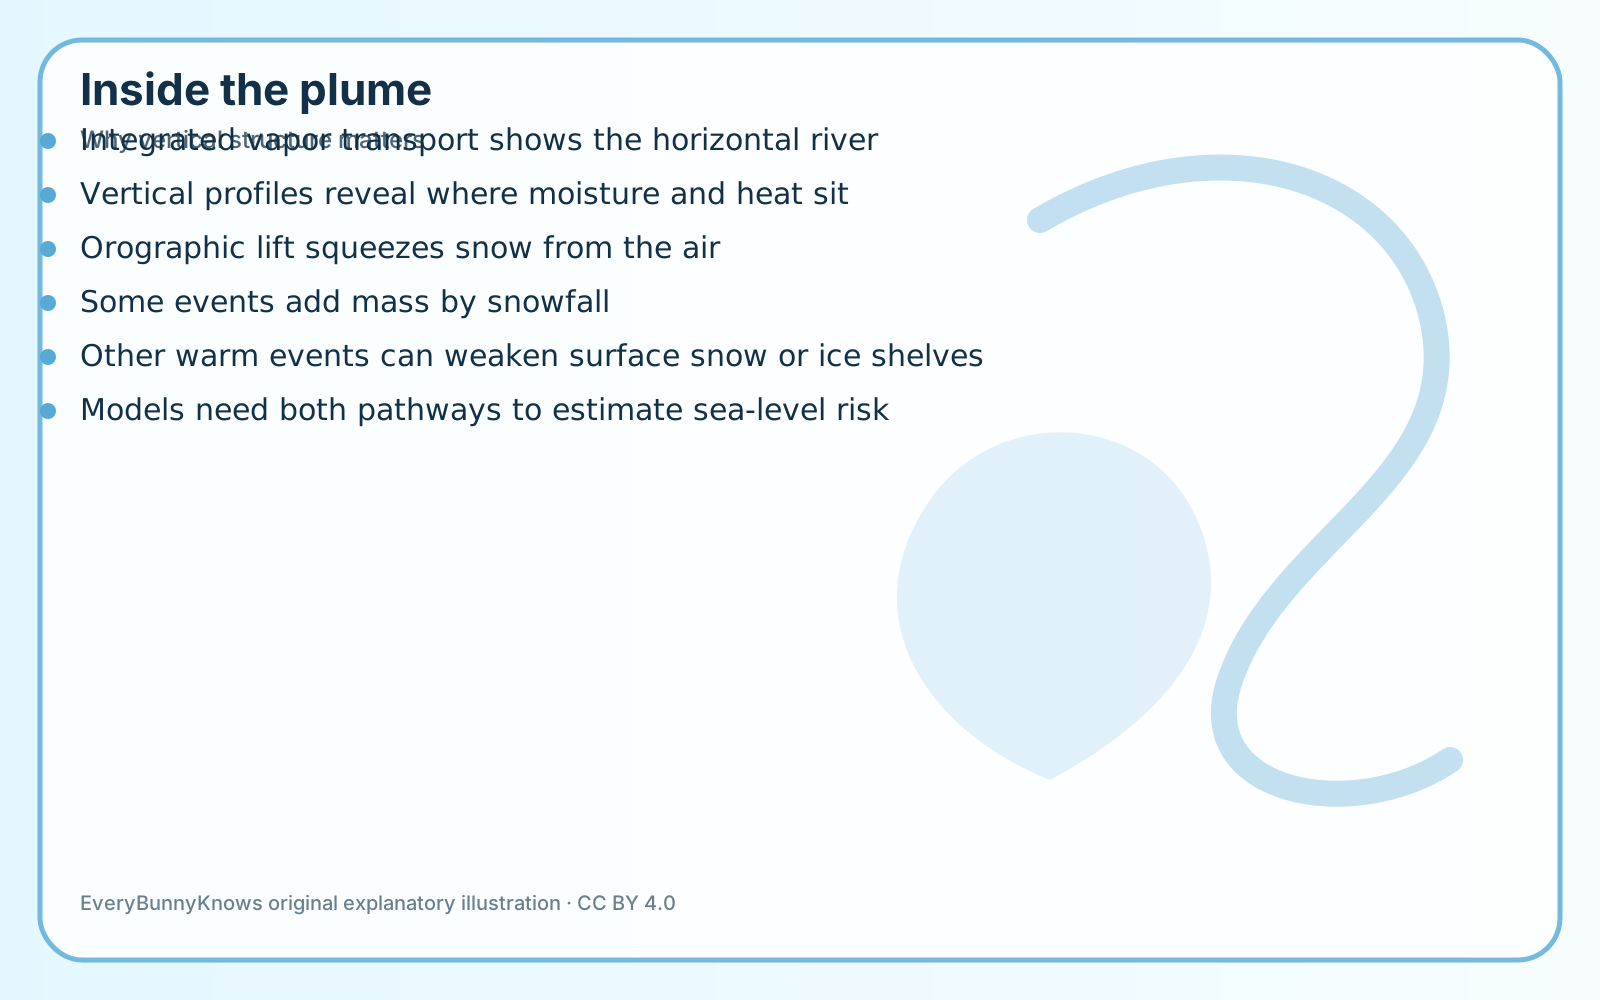
The mechanism begins far from the pole. Storm systems and pressure patterns gather warm, moist air from lower latitudes and focus it into a narrow transport band. Meteorologists often describe the strength of that band using integrated vapor transport, a measure that combines moisture and wind. When the plume reaches Antarctica, the air is forced upward. Cooling can squeeze out snow, adding mass to part of the ice sheet. Under warmer conditions, however, the same event can bring rain, surface melt, foehn-like downslope winds or stress to ice shelves.
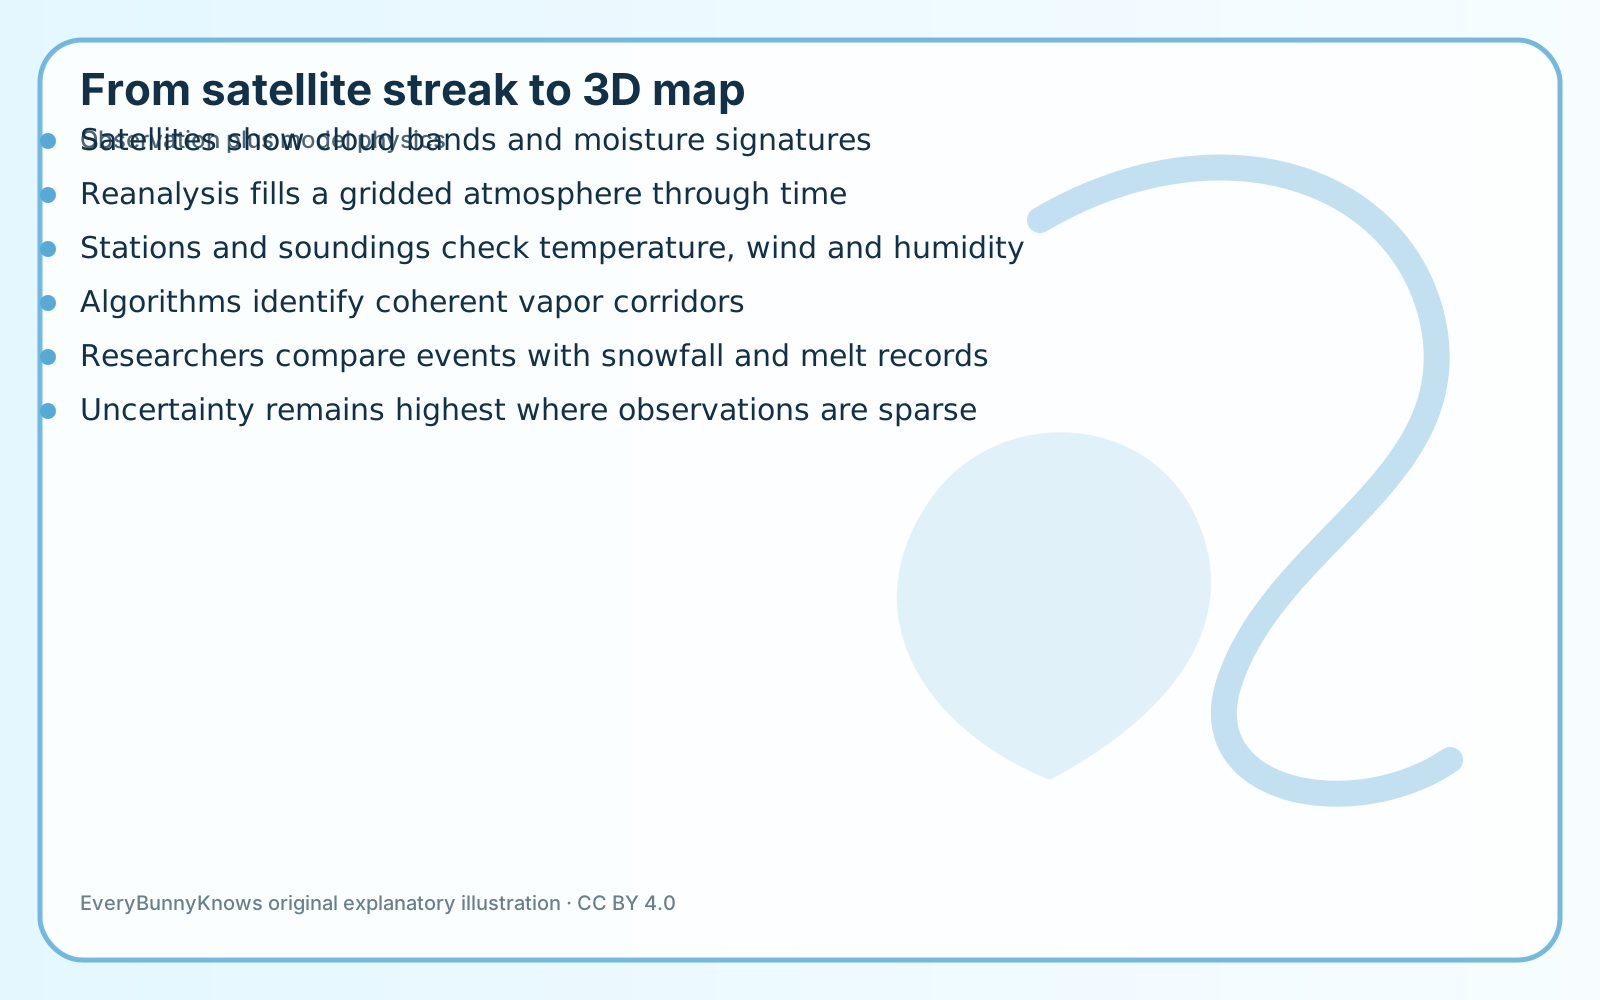
This is why the new three-dimensional view is valuable. It does not simply say that an atmospheric river touched the coast. It asks where the vapor was, how high it reached, which layers carried heat, and how the plume interacted with terrain. Researchers can combine satellite observations, weather reanalysis, station data, aircraft or balloon measurements where available, and algorithms that identify coherent vapor corridors. The result is closer to a moving weather volume than a line drawn on a map.
The stakes are practical because Antarctic mass balance is a ledger with two sides. Snowfall can add ice, while melt, rain, ocean-driven thinning and ice-shelf weakening can help remove or destabilize it. Atmospheric rivers can appear on either side of that ledger depending on timing, temperature and location. In some coastal sectors or individual years, a small number of intense events may account for a large share of annual snowfall. In other cases, warm, moist air can contribute to surface melt episodes that matter for ice-shelf stability.
There are strong limits to the science. Antarctica has sparse observations compared with populated continents, and reanalysis products are partly model reconstructions. Algorithms may not always agree on where an atmospheric river begins or ends. A single event cannot be translated directly into sea-level rise, and a snowy storm is not automatically good news if the same pattern also brings damaging heat elsewhere. The value of 3D mapping is that it makes those differences easier to test instead of hiding them in averages.
For readers, the discovery changes the mental image of Antarctica. The ice sheet is not sealed off from the rest of the planet. It is connected to lower latitudes by moving rivers in the sky, by storms that carry moisture and heat, and by topography that decides what the air does when it arrives. The hopeful part is methodological: better maps do not make the risk vanish, but they give scientists and planners a clearer way to separate snow-building events from melt-risk events and to improve the models used for future coastlines.