MIZ-ing in Action: How Much Antarctic Sea Ice Do Waves Disturb?
The Antarctic marginal ice zone is not a neat boundary but a storm-sensitive band where ocean waves bend, break and rearrange sea ice — and satellite radar is helping scientists estimate how wide that band really is.
Ada Brooks ·
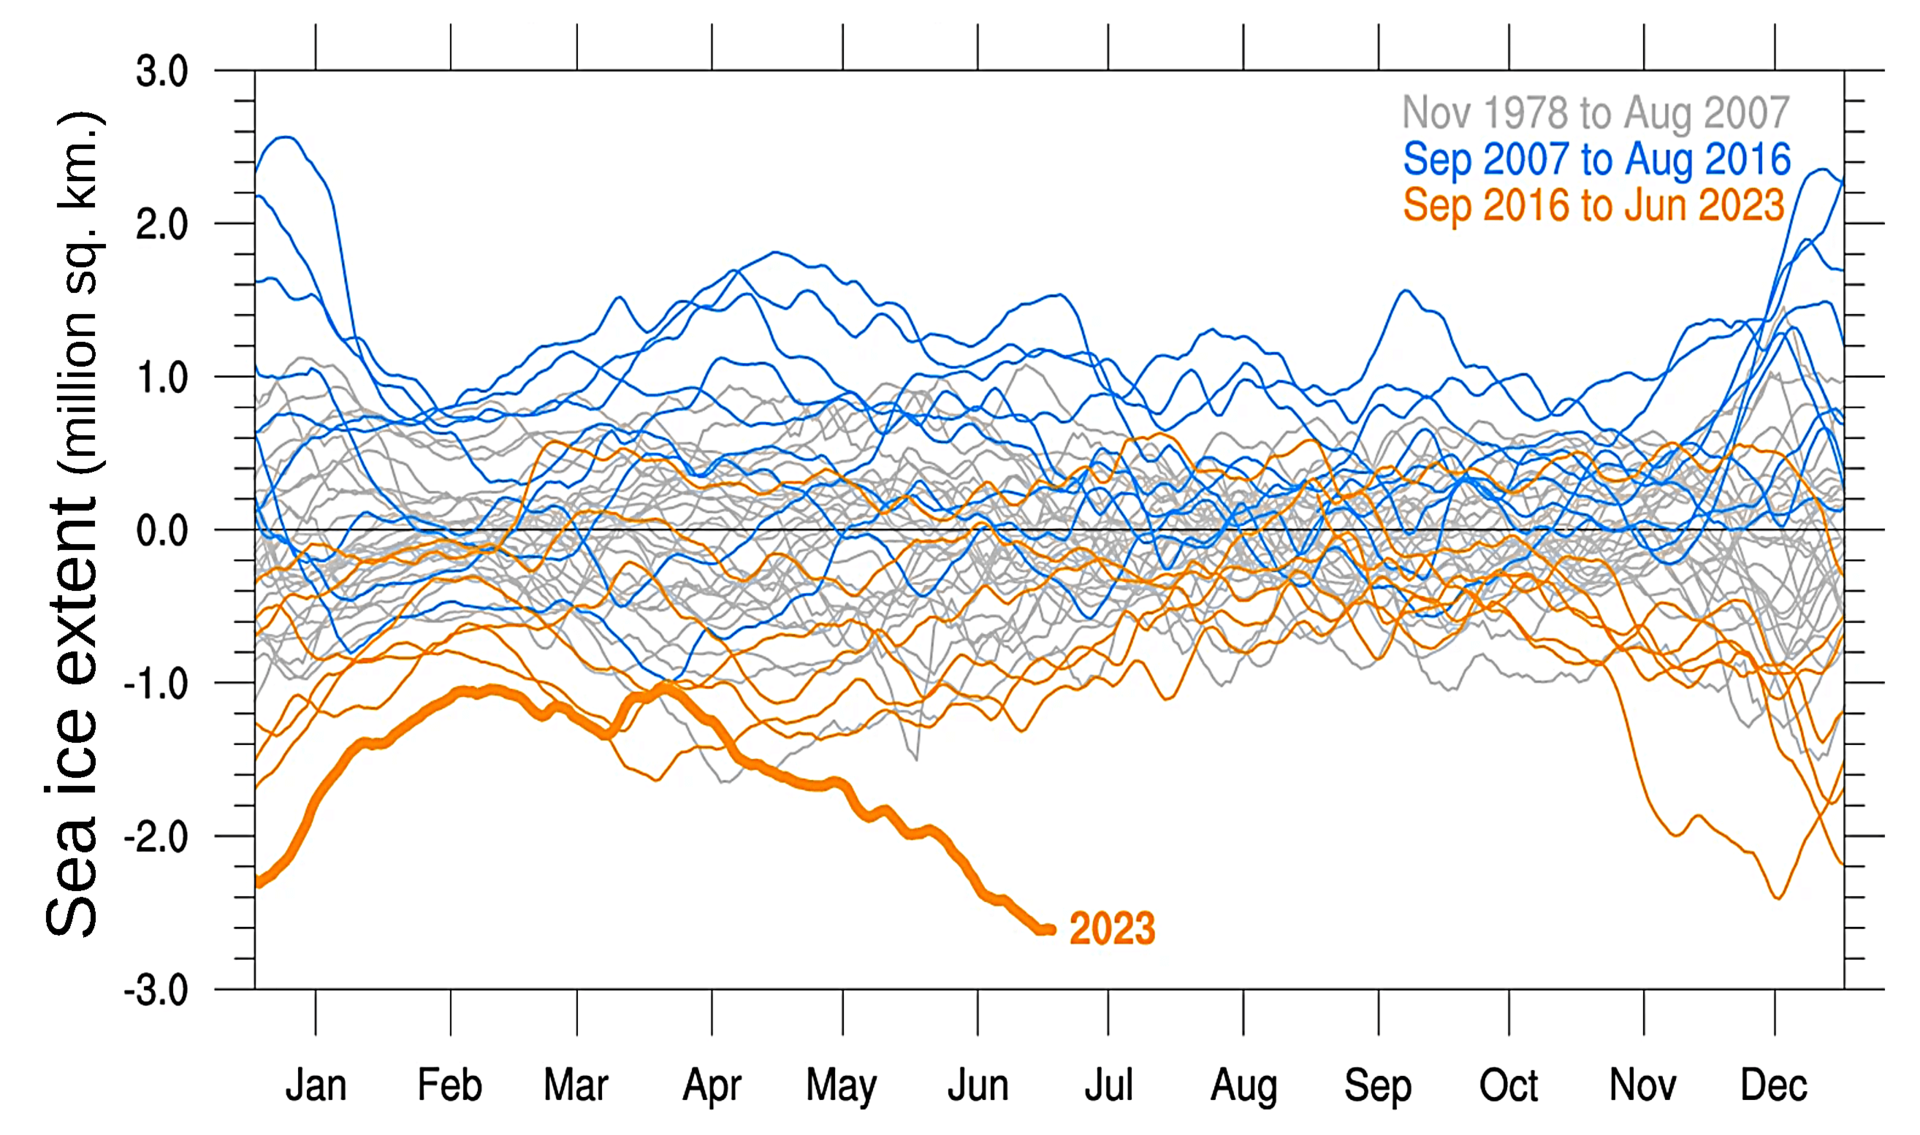
Antarctic sea ice does not end like a coastline. Around much of the continent, the solid-looking pack gives way to a restless outer band where ocean swell travels into ice, floes bend and collide, leads open, and storms can rearrange the surface in hours. Scientists call this the marginal ice zone, or MIZ, and its size matters because it is the place where the ocean most directly transfers wave energy into the ice cover.
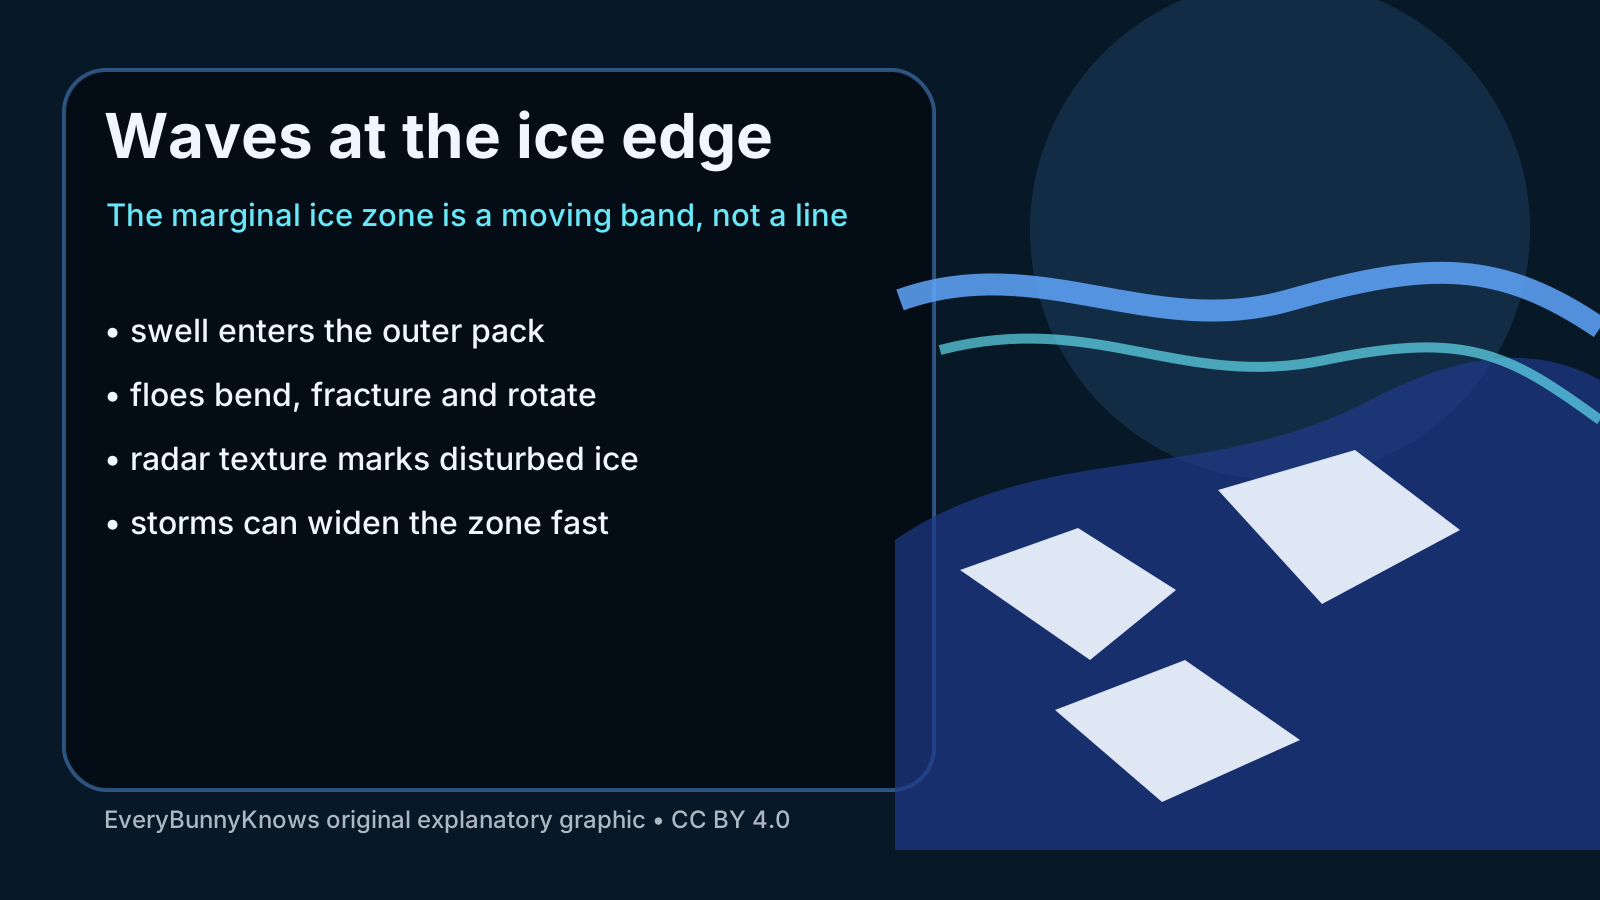
The basic mechanism is easy to picture and hard to measure. Long waves generated by Southern Ocean storms enter the outer pack. Large floes may flex; smaller floes may rotate, raft or collide; thin ice may fracture; and open water between floes allows more wave motion to penetrate. The result is neither open ocean nor continuous pack ice. It is a transitional geography, with width and structure changing by season, weather, ice concentration and distance from the ice edge.
Satellite observations are changing how that transition can be mapped. Passive microwave sensors have long been used to estimate sea-ice extent, while synthetic aperture radar can see fine surface texture through cloud and polar darkness. Researchers studying the Antarctic MIZ use changes in radar backscatter, roughness, floe pattern and ice concentration to distinguish compact pack from wave-affected ice. Older radar records can become newly valuable when algorithms are trained to ask a different question: not just where ice exists, but where waves are changing its behaviour.
That distinction matters for climate models. The marginal ice zone controls how momentum, heat and salt move between ocean, atmosphere and ice. A wider wave-broken zone can expose more ocean to the air, alter melt and freeze processes, and change how quickly ice cover responds to storms. For ships and research stations, better MIZ maps also have practical value: a route that looks safe on a coarse ice chart can become difficult if swell has broken the pack into mobile floes.
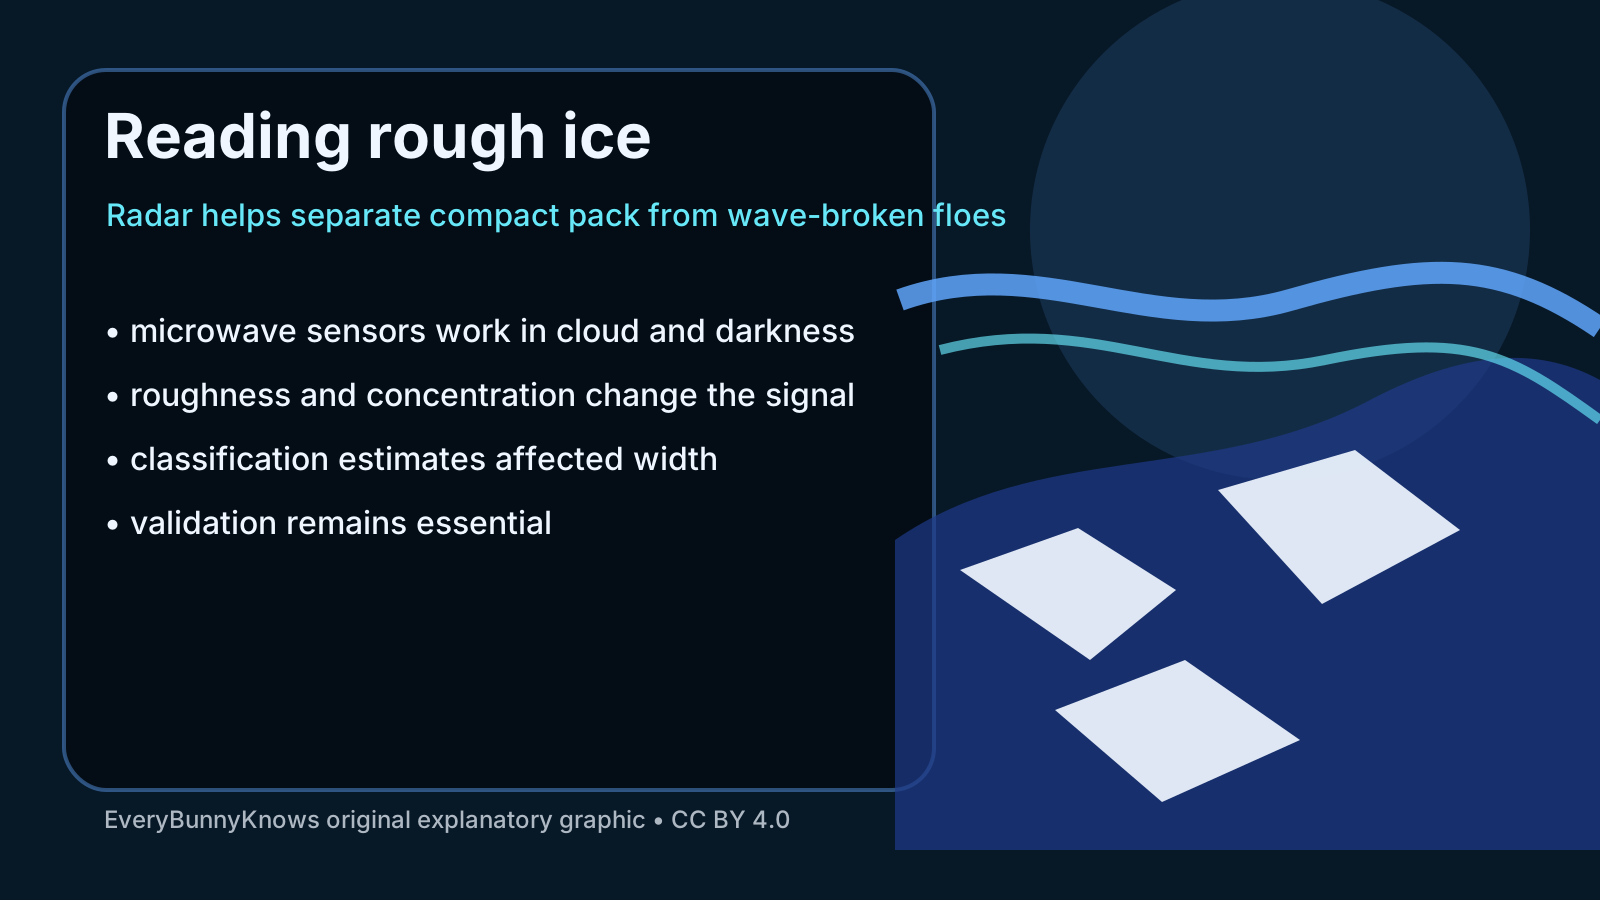
There are important limits. Radar does not measure “wave damage” directly in a simple way; it records microwave signals that must be interpreted against weather, sensor angle, snow conditions, ice type and ground or ship observations where available. A classification that works in one season or sector may need adjustment elsewhere. The Antarctic ice edge is also far from uniform. The Weddell Sea, Ross Sea and Indian Ocean sectors face different storm tracks, currents and ice histories, so a single number for the MIZ can hide a complex map.
The useful idea is not that scientists have finally drawn one perfect boundary. It is that the boundary itself is becoming a subject of measurement. The MIZ shows why polar geography is dynamic: wind makes waves, waves reshape ice, ice changes the ocean surface, and the changed surface feeds back into weather and climate. As Antarctic sea ice has shown unusually large year-to-year swings in the satellite era, knowing how much of the pack is exposed to wave action becomes more than a technical detail. It helps explain how a distant ring of ice responds to a restless ocean, and how a line on a map becomes a moving zone of energy.